GNU/Linux下科学计算绘图工具
(以“== Gnuplot == Gnuplot是一个比较强大的绘图软件包,可以进行绝大多数的科学绘图 octave, maxima 都用它作为后台绘图引擎. 官方站...”为内容创建页面) |
(→Octave) |
||
| (未显示1个用户的7个中间版本) | |||
| 第12行: | 第12行: | ||
| − | + | 以下是一些示例,点击查看大图: | |
| + | <gallery> | ||
| + | 文件:Gnuplot-sinc.png | Sinc Function | ||
| − | Fence Plot | + | 文件:Gnuplot-fence.png | Fence Plot |
| + | 文件:Gnuplot-Interlocking.png | Fence Plot | ||
| − | + | 文件:Gnuplot-earth.png | Earth | |
| + | </gallery> | ||
| − | + | ;参考资料: | |
| + | |||
| + | Learning gnuplot: http://www.gnuplot.info/help.html | ||
| + | |||
| + | Plot example: http://gnuplot.sourceforge.net/demo/ | ||
| + | |||
| + | Document: http://www.gnuplot.info/documentation.html | ||
| 第27行: | 第37行: | ||
== Octave == | == Octave == | ||
| + | |||
| + | 兼容 MatLab 语法的科学计算工具,具有丰富的 C++ 接口供用户使用 | ||
| + | |||
| + | 其绘图功能使用用的是 gnuplot,因此其依赖 Gnuplot 包 | ||
| + | |||
| + | 官方站点: http://www.octave.org | ||
| + | |||
| + | Debian/Ubuntu 的官方源里都有,可以直接 apt-get install octave 安装之 | ||
| + | |||
| + | 安装完后,直接在终端下输入 octave 回车即进入 octave 环境 | ||
| + | |||
| + | |||
| + | 一个频谱分析示例(快速傅立叶分析): | ||
| + | |||
| + | <pre> | ||
| + | octave:1> t = 0:0.001:0.6; | ||
| + | octave:2> x = sin(2*pi*50*t) + sin(2*pi*120*t); | ||
| + | octave:3> y = x + 2*randn(1,length(t)); | ||
| + | octave:4> z = fft(y,512); | ||
| + | octave:5> pz = z.*conj(z)/512; | ||
| + | octave:6> f = 1000 * (0:255) / 512; | ||
| + | octave:7> plot(f,pz(1:256),'b',xlabel('Frequency spectrum')) | ||
| + | octave:8> | ||
| + | </pre> | ||
| + | |||
| + | |||
| + | [[文件:Octave-fft.png]] | ||
| + | |||
| + | |||
| + | 以下还有一些示例,点击查看大图: | ||
| + | |||
| + | <gallery> | ||
| + | 文件:Octave-sin.png | ||
| + | 文件:Octave-peaks.png | ||
| + | 文件:Octave-mesh.png | ||
| + | </gallery> | ||
| + | |||
| + | |||
| + | ;参考资料: | ||
| + | |||
| + | 可以参考 MatLab 的部分文档,octave 语法与 MatLab 兼容。 | ||
| + | |||
| + | 如signal processing 部分: http://www-ccs.ucsd.edu/matlab/toolbox/signal/reftable.html | ||
| + | |||
| + | Manual: http://www.gnu.org/software/octave/doc/interpreter/ | ||
| + | |||
| + | 安装 octave2.9-doc 包,在 /usr/share/doc/octave2.9-doc/ 下有 liboctave.pdf.gz 是为octave开发库文档。 | ||
| + | |||
| + | |||
2012年12月25日 (二) 14:00的最后版本
[编辑] 1 Gnuplot
Gnuplot是一个比较强大的绘图软件包,可以进行绝大多数的科学绘图
octave, maxima 都用它作为后台绘图引擎.
官方站点: http://www.gnuplot.info
Debian/Ubuntu 的官方源里都有,可以直接 apt-get install gnuplot gnuplot-doc 安装之
安装 gnuplot-doc 包后,在 /usr/share/doc/gnuplot-doc/examples/ 下有很多例子可以参考,有兴趣的可以看看
以下是一些示例,点击查看大图:
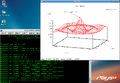
Sinc Function
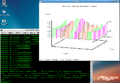
Fence Plot
Fence Plot
Earth


- 参考资料:
Learning gnuplot: http://www.gnuplot.info/help.html
Plot example: http://gnuplot.sourceforge.net/demo/
Document: http://www.gnuplot.info/documentation.html
[编辑] 2 Octave
兼容 MatLab 语法的科学计算工具,具有丰富的 C++ 接口供用户使用
其绘图功能使用用的是 gnuplot,因此其依赖 Gnuplot 包
官方站点: http://www.octave.org
Debian/Ubuntu 的官方源里都有,可以直接 apt-get install octave 安装之
安装完后,直接在终端下输入 octave 回车即进入 octave 环境
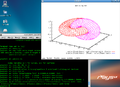
一个频谱分析示例(快速傅立叶分析):
octave:1> t = 0:0.001:0.6;
octave:2> x = sin(2*pi*50*t) + sin(2*pi*120*t);
octave:3> y = x + 2*randn(1,length(t));
octave:4> z = fft(y,512);
octave:5> pz = z.*conj(z)/512;
octave:6> f = 1000 * (0:255) / 512;
octave:7> plot(f,pz(1:256),'b',xlabel('Frequency spectrum'))
octave:8>

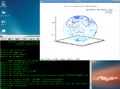
以下还有一些示例,点击查看大图:


- 参考资料:
可以参考 MatLab 的部分文档,octave 语法与 MatLab 兼容。
如signal processing 部分: http://www-ccs.ucsd.edu/matlab/toolbox/signal/reftable.html
Manual: http://www.gnu.org/software/octave/doc/interpreter/
安装 octave2.9-doc 包,在 /usr/share/doc/octave2.9-doc/ 下有 liboctave.pdf.gz 是为octave开发库文档。