GNU/Linux下科学计算绘图工具
来自Jack's Lab
(版本间的差异)
(→Gnuplot) |
(→Gnuplot) |
||
| 第11行: | 第11行: | ||
安装 gnuplot-doc 包后,在 /usr/share/doc/gnuplot-doc/examples/ 下有很多例子可以参考,有兴趣的可以看看 | 安装 gnuplot-doc 包后,在 /usr/share/doc/gnuplot-doc/examples/ 下有很多例子可以参考,有兴趣的可以看看 | ||
| + | <gallery> | ||
| + | 文件:Gnuplot-sinc.png | Sinc Function | ||
| − | + | 文件:Gnuplot-fence.png | Fence Plot | |
| − | + | 文件:Gnuplot-Interlocking.png | Fence Plot | |
| − | + | ||
| − | + | ||
| − | Fence Plot | + | |
| − | + | ||
| − | + | ||
| − | + | ||
| − | + | ||
| − | + | ||
| − | + | ||
| − | + | ||
| − | + | ||
| − | + | ||
| − | + | ||
| − | + | ||
| − | + | ||
| + | 文件:Gnuplot-earth.png | Earth | ||
| + | </gallery> | ||
2012年12月25日 (二) 01:08的版本
1 Gnuplot
Gnuplot是一个比较强大的绘图软件包,可以进行绝大多数的科学绘图
octave, maxima 都用它作为后台绘图引擎.
官方站点: http://www.gnuplot.info
Debian/Ubuntu 的官方源里都有,可以直接 apt-get install gnuplot gnuplot-doc 安装之
安装 gnuplot-doc 包后,在 /usr/share/doc/gnuplot-doc/examples/ 下有很多例子可以参考,有兴趣的可以看看
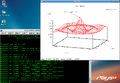
Sinc Function
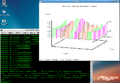
Fence Plot
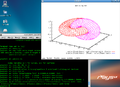
Fence Plot
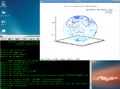
Earth


- 参考资料:
Learning gnuplot: http://www.gnuplot.info/help.html
Plot example: http://gnuplot.sourceforge.net/demo/
Document: http://www.gnuplot.info/documentation.html
2 Octave